
West Midlands Mayor election: Full results from across the region
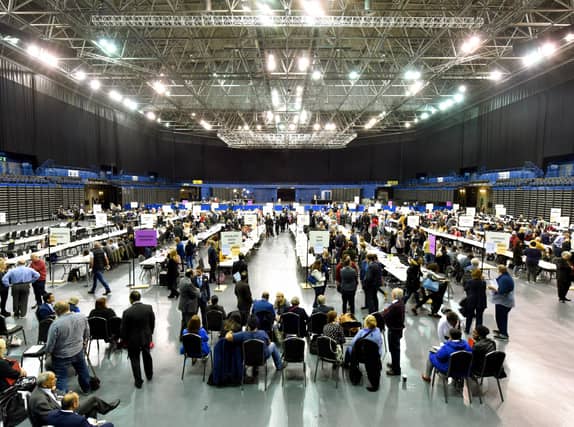

The final full results from the West Midlands Mayor election, broken down by area.
Mayoral elections use the supplementary voting system, meaning the candidates needed 50 per cent of first-choice votes to win in the first round.
As nobody achieved that threshold, the vote went to a second round. In this second round, all but the top two candidates - Sion Simon and Andy Street - were eliminated.
The second preferences of people who voted for any of the four eliminated candidates were counted, and those for Mr Simon or Mr Street were added to their first preference votes.
Mr Street finished with 238,628 - just 3,766 more than Mr Simon.
Overall results with first and second preferences
- Andy Street (Conservative) 238,628
- Sion Simon (Labour) 234,862
Overall first preference results
- Andy Street (Conservative) 216,280 (41.92 per cent)
- Sion Simon (Labour) 210,259 (40.75 per cent)
- Beverley Nielsen (Lib Dem) 30,378 (5.89 per cent)
- Pete Durnell (UKIP) 29,051 (5.63 per cent)
- James Burn (Green) 24,260 (4.7 per cent)
- Graham Stevenson (Communist) 5,696 (1.1 per cent)
Rejected votes: 7,268. Turnout: 26.7 per cent.
Overall second preference results
All but the top two candidates are eliminated after the first round. Only the second preferences from the eliminated candidates are counted.
- Sion Simon (Labour) 24,603
- Andy Street (Conservative) 22,348
Birmingham results
First round
- Sion Simon (Labour) 95,098
- Andy Street (Conservative) 73,578
- Beverley Nielsen (Lib Dem) 14,840
- James Burn (Green) 9,787
- Pete Durnell (UKIP) 7,537
- Graham Stevenson (Communist) 2,312
Rejected votes: 3,299
Second preference
- Sion Simon 10,382
- Andy Street 7,690
Not counted/rejected: 2,988
Coventry
First round
- Sion Simon (Labour) 24,331
- Andy Street (Conservative) 20,345
- Beverley Nielsen (Lib Dem) 3,339
- James Burn (Green) 2,984
- Pete Durnell (UKIP) 2,928
- Graham Stevenson (Communist) 821
Rejected votes: 903
Second preference:
- Sion Simon 3,236
- Andy Street 2,213
Not counted/rejected: 694
Dudley result
First round
- Andy Street (Conservative) 31,858
- Sion Simon (Labour) 17,731
- Beverley Nielsen (Lib Dem) 2,555
- Pete Durnell (UKIP) 5,637
- James Burn (Green) 2,096
- Graham Stevenson (Communist) 623
Rejected votes: 588
Second preference:
- Andy Street 3,306
- Sion Simon 2,446
Not counted/rejected: 888
Sandwell results
First round
- Sion Simon (Labour) 29,085
- Andy Street (Conservative) 14,361
- Pete Durnell (UKIP) 4,704
- James Burn (Green) 2,032
- Beverley Nielsen (Lib Dem) 2,029
- Graham Stevenson (Communist) 672
Rejected votes: 774
Second preference:
- Sion Simon 2,476
- Andy Street 2,260
Not counted/rejected: 4,701
Solihull results
First round
- Andy Street (Conservative) 35,903
- Sion Simon (Labour) 6,695
- James Burn (Green) 4102
- Beverley Nielsen (Lib Dem) 3,578
- Pete Durnell (UKIP) 1,833
- Graham Stevenson (Communist) 256
Rejected votes: 504
Second preference:
- Andy Street 2,981
- Sion Simon 2,256
Not counted/rejected: 741
Walsall results
First round
- Andy Street (Conservative) 23,694
- Sion Simon (Labour) 16,725
- Pete Durnell (UKIP) 3501
- Beverley Nielsen (Lib Dem) 2,047
- James Burn (Green) 1,465
- Graham Stevenson (Communist) 442
Rejected votes: 592
Second preference:
- Andy Street 2,186
- Sion Simon 1,811
Not counted/rejected: 602
Wolverhampton results
- Sion Simon (Labour) 20,594
- Andy Street (Conservative) 16,514
- Pete Durnell (UKIP) 2,911
- Beverley Nielsen (Lib Dem) 1,990
- James Burn (Green) 1,794
- Graham Stevenson (Communist) 570
Rejected votes: 608
Second preference:
- Sion Simon 1,996
- Andy Street 1,712
Not counted/rejected: 691