
Latest NHS hospital figures for England: Key numbers and trends

The percentage of people on the list for hospital treatment who have waited more than 52 weeks has increased.
Long waits for treatment continue to increase and cancer referrals have slipped behind target, as A&E departments face a record number of attendances.
Here, the Press Association highlights the key numbers and trends in the latest hospital performance figures from NHS England:
– Overall waiting list
The waiting list for routine hospital treatments has risen to its highest level for nearly a year.
An estimated 7.38 million treatments were waiting to be carried out at the end of September, relating to 6.24 million patients.
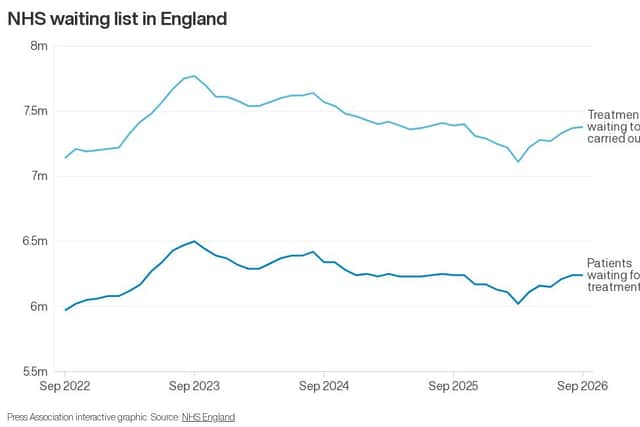
This is up slightly from 7.37 million treatments at the end of August and is the highest since the list stood at 7.40 million treatments in October 2025.
The figure for patients is broadly unchanged month on month, but is also at a level that was previously seen in October 2025.
The waiting list hit a record high in September 2023, with 7.77 million treatments and 6.50 million patients.
Some 65.8% of patients in September began hospital treatment within 18 weeks of referral, up from 65.2% in August and above the target of 65% that the Government and NHS England had set for March of this year.
The next target is 70%, which has been set for March 2027.
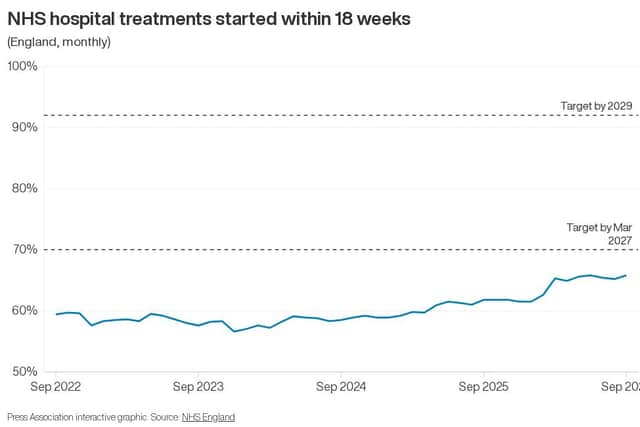
The Government has also pledged that 92% of patients in England will begin treatment within 18 weeks by the end of the current Parliament in 2029.
– Long waits for treatment
An estimated 116,353 people had been waiting more than a year to start routine treatment at the end of September, up from 113,339 at the end of August.
The number waiting more than 65 weeks has also increased month on month, from 10,782 to 12,825, as has the number waiting more than 18 months, from 1,637 to 2,015.
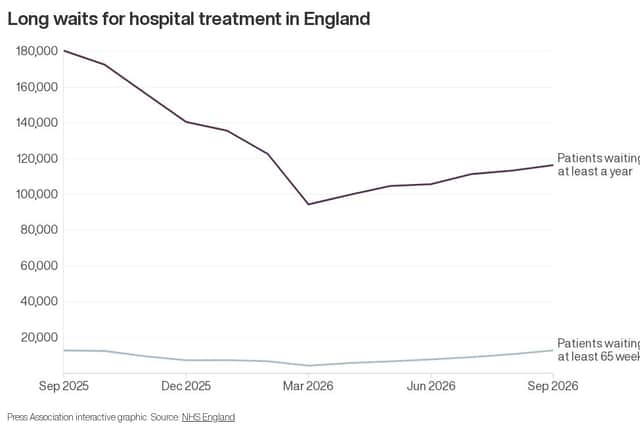
Some 1.6% of people on the list for hospital treatment had been waiting more than 52 weeks in September, up month on month from 1.5%.
The Government and NHS England had set a target of March this year for the figure to be reduced to less than 1%.
– Corridor care
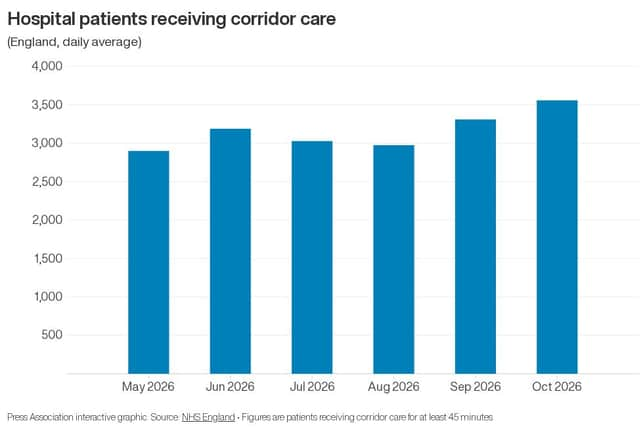
An average of 3,558 patients received corridor care each day in October, with 2,718 in A&E departments and 840 in other hospital areas.
These are the highest figures for corridor care in the six months since data began in May 2026.
The October total is up from a revised average of 3,310 patients per day in September, made up of 2,550 in A&Es and 760 in other areas.
The figures cover patients who have been receiving corridor care for at least 45 minutes.
A patient is classed as receiving corridor care if their treatment does not take place in a clinically appropriate and safe setting.
The criteria used for defining an appropriate setting include at-bed services such as oxygen and call bells; whether privacy can be maintained; access to food, water and toilets; and whether lights can be turned off and noise levels minimised to allow sleep.
– Accident & emergency attendances
A record 2.50 million people visited A&E departments in England in October.
It is the first time monthly attendances have passed two and a half million.
Some 74.0% of patients were seen within four hours in A&Es in October, down slightly from 74.4% in September.
The Government and NHS England had set a target of March this year for 78% of patients attending A&E to be admitted, discharged or transferred within four hours.
A fresh target has been set of March 2027 for every NHS trust to reach 82%.
– Cancer referrals
A total of 76.2% of patients in England urgently referred for suspected cancer were diagnosed or had cancer ruled out within 28 days in September.
This is down from 78.6% in August and is below the target of 80%.
The proportion of patients who began their first definitive treatment for cancer in September within 62 days of an urgent referral or consultant upgrade was 70.7%, down from 71.9% in August.
The Government and NHS England have set a target of March 2027 for every NHS trust to reach 80% for the 62-day measure.
– Ambulance response times
The average response time in October for ambulances dealing with the most urgent incidents, defined as calls from people with life-threatening illnesses or injuries, was seven minutes and 59 seconds.
This is unchanged from September but is longer than the target standard response time of seven minutes.
Ambulances took an average of 32 minutes and 45 seconds last month to respond to emergency calls such as heart attacks, strokes and sepsis.
This is up from 31 minutes and 18 seconds in September.
The Government and NHS England have set a target for this figure to average 25 minutes across 2026/27.
The average currently stands at 29 minutes and 53 seconds.
Response times for urgent calls, such as late stages of labour, non-severe burns and diabetes, averaged two hours, seven minutes and 32 seconds in October, up from one hour, 57 minutes and 44 seconds in September.